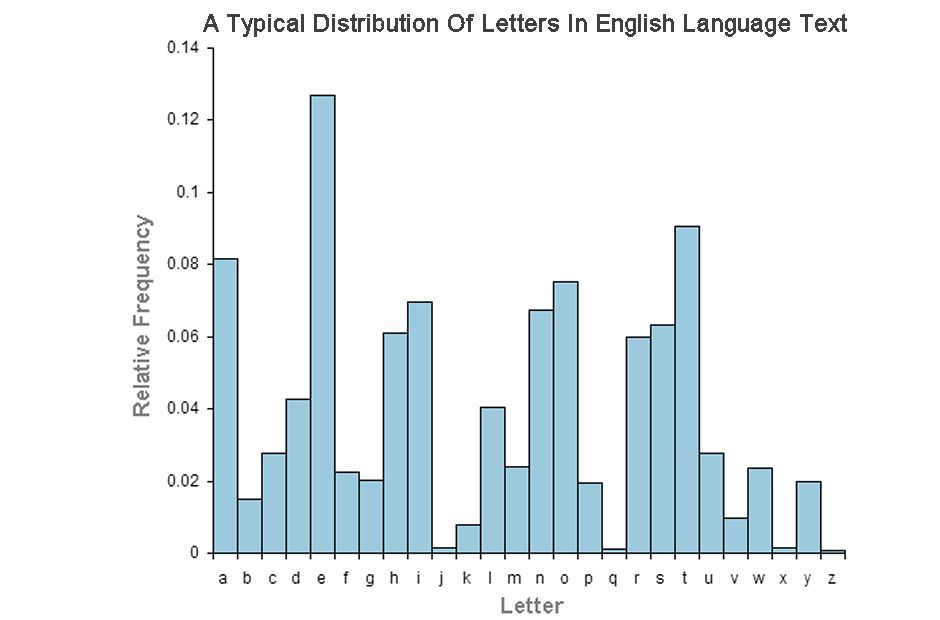
Relative Frequencies of Letters in the English Language Graph
This method of creating secret messages is not very secure.
Short messages can be deciphered by just applying all 25 possible shifts and reading the output; longer ones can be attacked by a method known as frequency analysis.
The distribution of letters in an average sample of English text has a predictable shape which is easy to determine. The Caesar cipher shift also shifts this distribution, and it is easy to determine the shift by analysing the resultant frequency graph.
We look for the most common letter in the message and assume this must correspond to the most common letter in the English language, e.
This gives us the shift and we can now read the message.
Continue Reading Caesar Cipher Python Code


Google Blockly Games Maze 1 Solution #Blockly #Javascript #Coding...
Smart Robot Car Kit DC Motors Installation #Robots #STEM #Makerspace...
Brain Controlled Prosthetic Arm Funded by DARPA: The Modular #Prosthetic Limb developed for #DARPA by...
Start a Code Club in Your School @CodeClub #Coding #Teachers #School...
Raspberry Pi vs Arduino Uno #RaspberryPi #Arduino...
Arduino IDE Software Components #Arduino #Software...